I don’t recall how I came across this Kubernetes IDE called Lens, but all I know is it’s cool as hec! It connects to a Kubernetes cluster (using the kube config file) and gives you an in depth view of all the different Kubernetes objects, their associated yaml files, health/metrics, etc. In this blog post I will show you how we can look into a Big Data Cluster’s Kubernetes infrastructure using Lens.
First let’s install Lens.
How To Install Lens
Originally, Lens was developed by a company called Kontena, Inc. Today, it is owned by Mirantis, Inc and is currently open-source. You can download the version for you (Mac, Linux or Windows) by going to their github page here.
After installing it, start it up..
THe first thing you will notice is that the “home” screen is pretty plain. Press the + sign on the upper left and side to add your Kubernetes cluster.
When you click the + sign, two screens show up. The left portion is “Add Cluster” and the right side is, “Clusters associated with Lens”. Let’s talk about the left side (Add Cluster) first (see screenshot below):
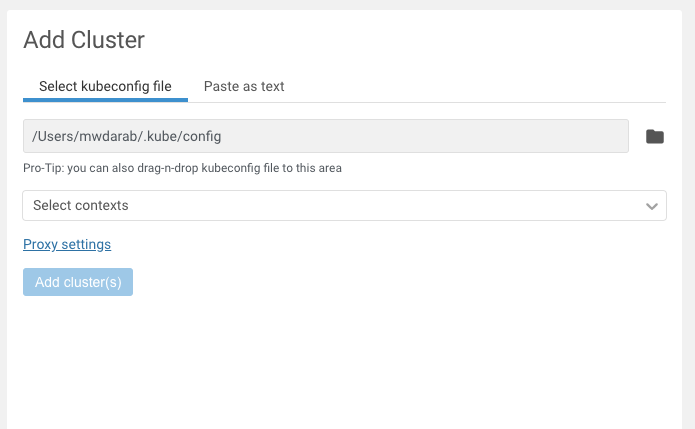
So you can either select a path to where your kube config file is, or paste the contents in under “Paste as text”. Under the “Select contexts” drop down, you will see a list of contexts that you can choose (extracted from your kube config file). You can choose just one, or multiple.
After all that, click “Add cluster(s)”
Just a quick note about the right side, “Clusters associated with Lens” (screenshot below):
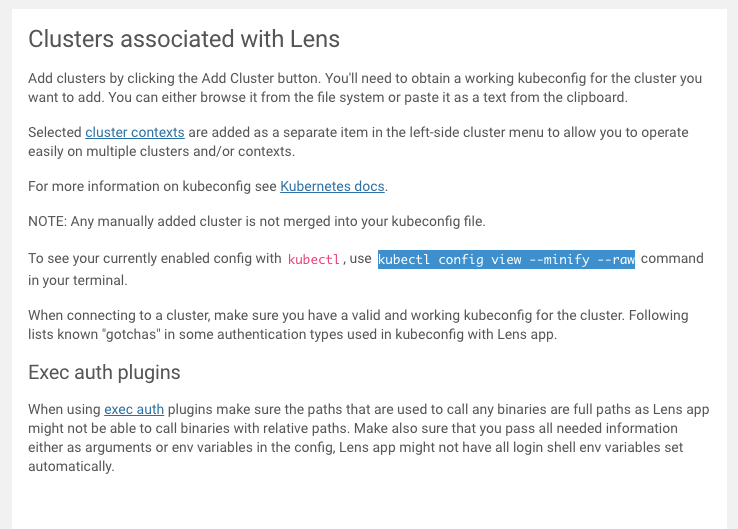
In case you don’t know the command to get your config file contents (if you wanted to paste it in, you can run the kubectl config view –minify –raw command and copy/paste that into the “Paste as text” tab.
Connecting to your Kubernetes Cluster
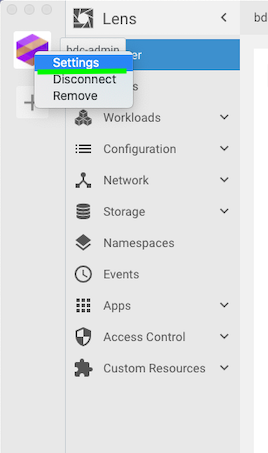
After clicking the “Add cluster” button you are brought to the “home screen”. On the left side pane you will see all the Kubernetes objects like, Nodes, Workloads, Configurations, Network, Storage, etc. Before diving into these, first right click the icon on the left and choose “Settings” (screenshot below):
Once the settings window comes up, you have a couple tidbits of information like Cluster Status, Cluster name and workspace, Cluster icon (you can change the icon), Features like Metrics install, and Removal (incase you wanted to remove your cluster. The first thing I recommend (and I did for my Big Data Cluster), was install the “Merics” feature (Prometheus). Once you install this, it will take a couple minutes to start showing metrics in your Home page (screenshot below)
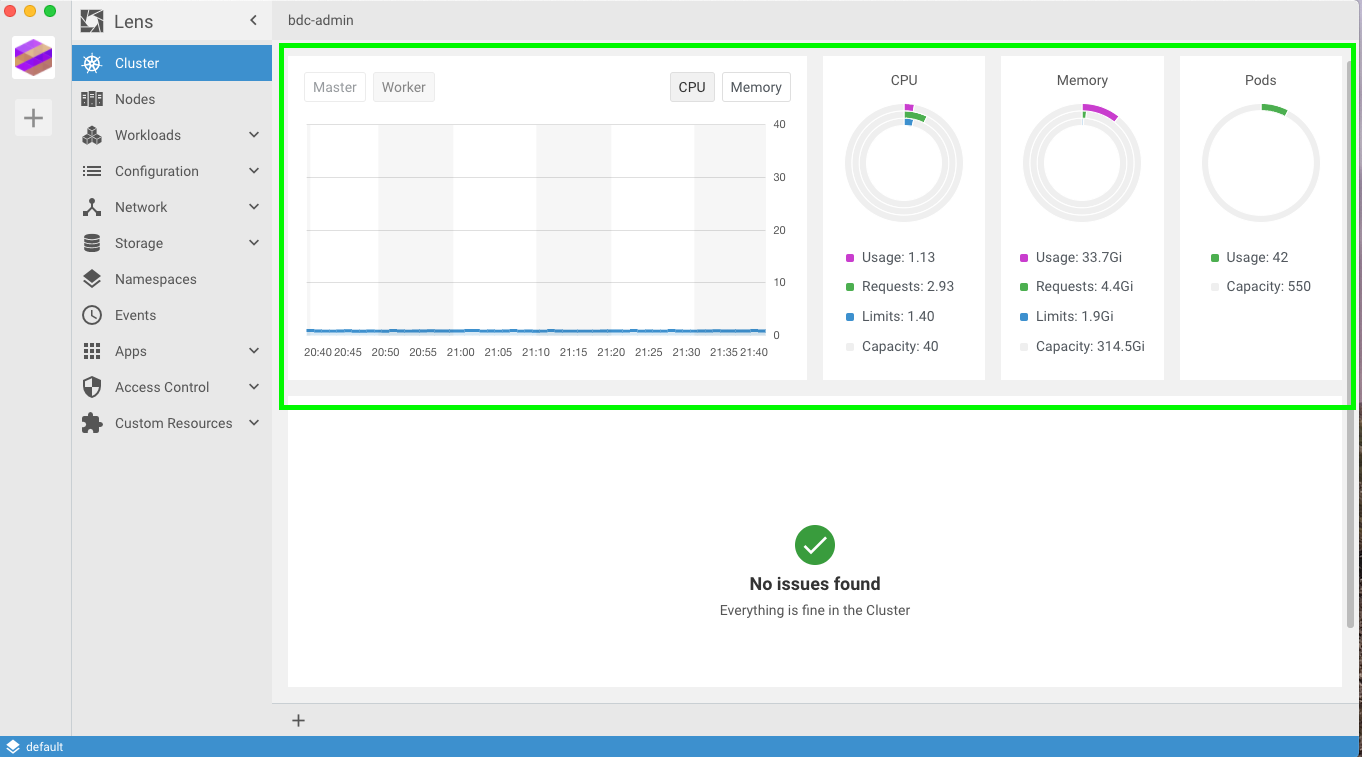
This is super cool because as soon as you log into Lens, you will see a quick view of CPU, Memory and Pods.
Let’s dive into some keys BDC areas using Lens. I’ll first start with the Nodes tab.
Nodes
Clicking on the Nodes icon on the left will show you all the nodes in your Big Data Cluster (remember you will not see the Master node if your BDC is running on an Azure Kubernetes Service cluster).
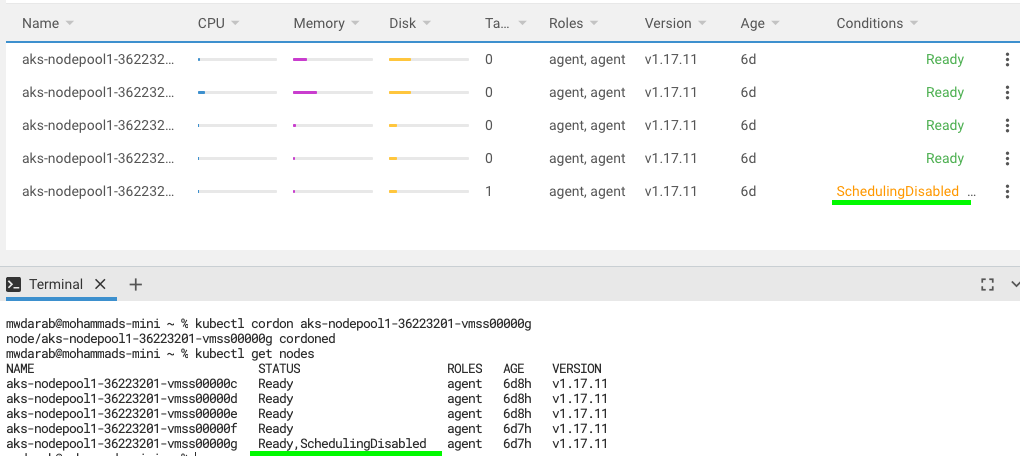
As you can see in the screenshot below, you see a list of my BDC worker nodes, CPU, Memory and Disk usage, Version and Age. If you click the veritical elipsis it gives you five options (Shell, Cordon, Drain, Edit, Remove).
Shell – opens a shell into the actual node
Cordon – will prevent pods from being scheduled on the node (see screenshot below). In order to make the node “schedule-able” again, click on “uncordon”
Drain – will remove all pods from the Node and place them on another node. I tried this on my BDC but advice *against* it. Try at your own risk, or on a test/dev environment.
Edit – Opens the node’s yaml file. (this file is for read only, do not try to modify this file and save it)
Remove – Remove the node (and of course, don’t do this). I tried to remove a node and it does remove it. All the pods that were on that node are scheduled on the remaining nodes. I tested this with my BDC on AKS and could connect to the BDC. Still not a good idea to do this! :)
Workloads
The workloads tab has a wealth of information. Click on the “overview” option and you will see a screen similar to mine below:
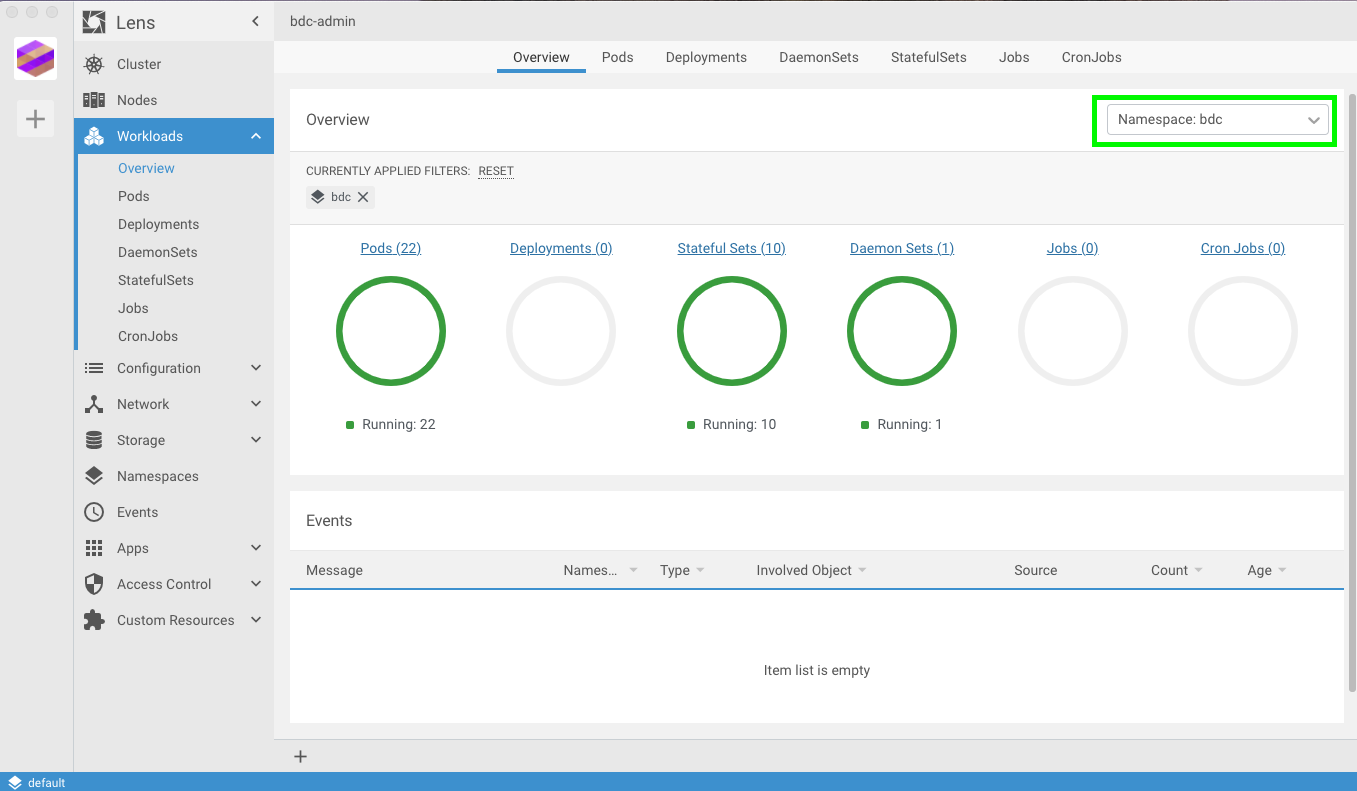
To drill down, I chose my BDC namespace (which I named ‘bdc’)from the drop down. You can see a couple ways to view different objects like Pods, Deployments, Jobs, etc. Let’s click on “Pods”..
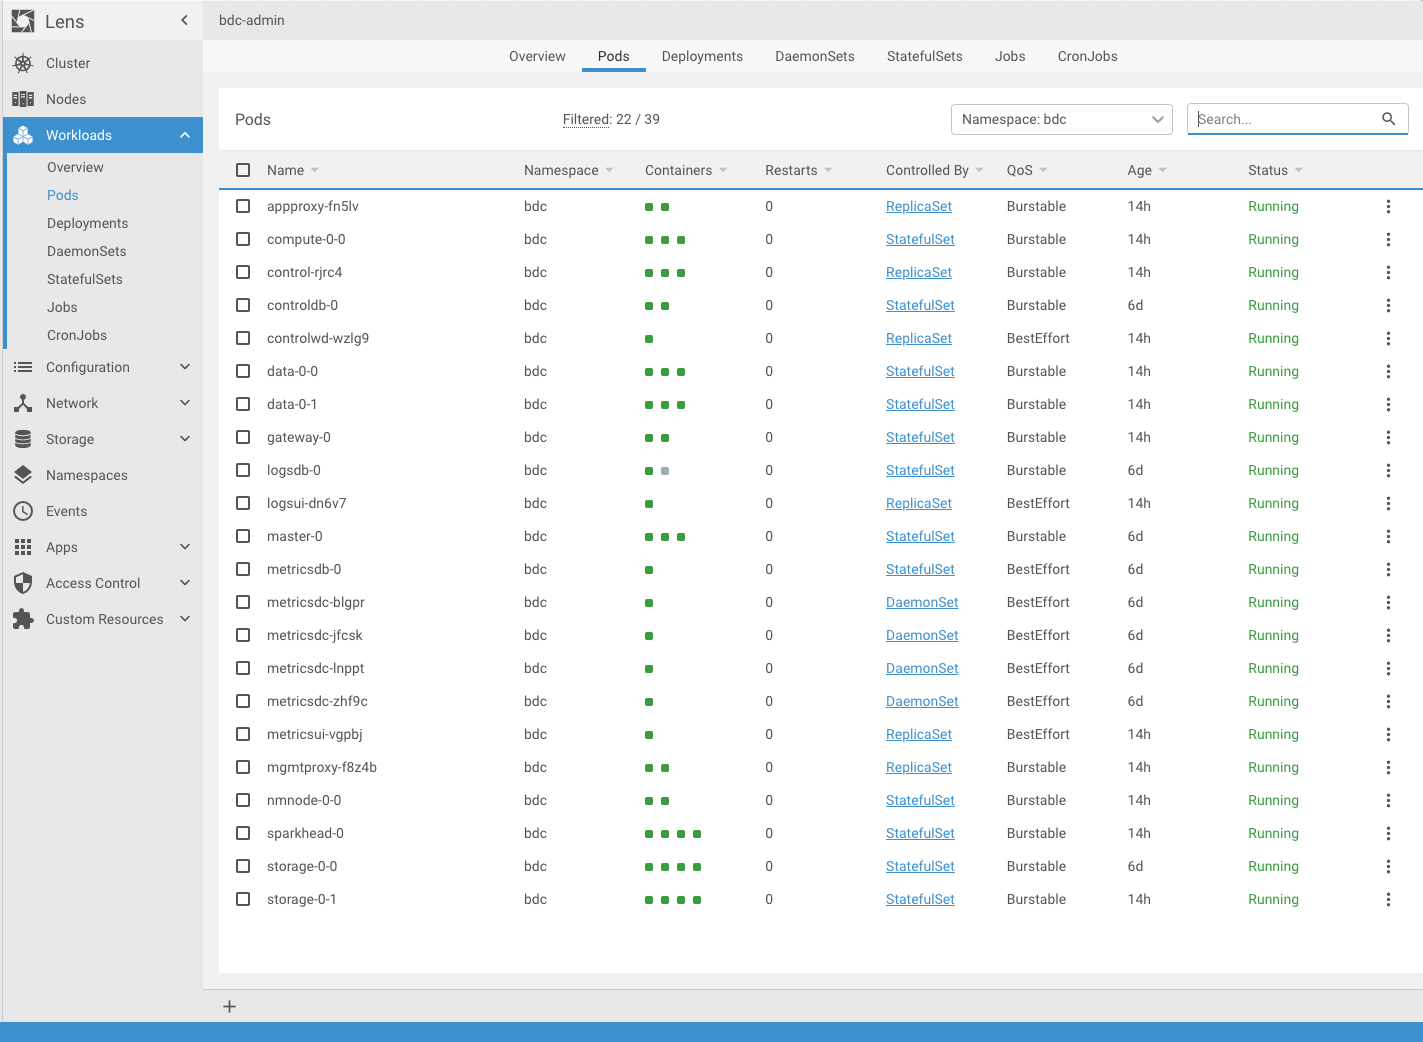
As you can see from the screenshot above, there are 22 pods in my BDC. Lens provides the namespace, container count per pod, number of restarts, controlled by (meaning are the pods part of a Deployment, or ReplicaSet), QoS, age and status. If you click on the vertical ellipsis you have four options as you can see in the image below:
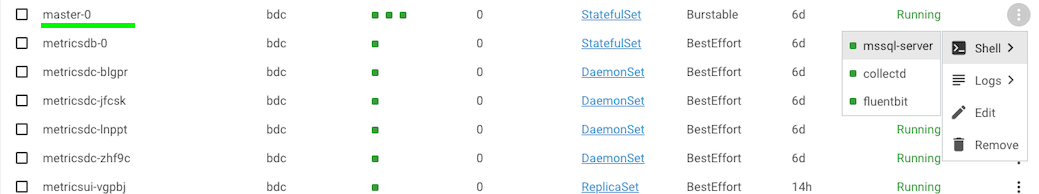
You can open a shell into any container within the pod. In the master-0 pod above, I can open a shell into the mssql-server container if need be. You can also view container logs for each container within the pod (neat!!) Let’s check out the mssql-server container logs:
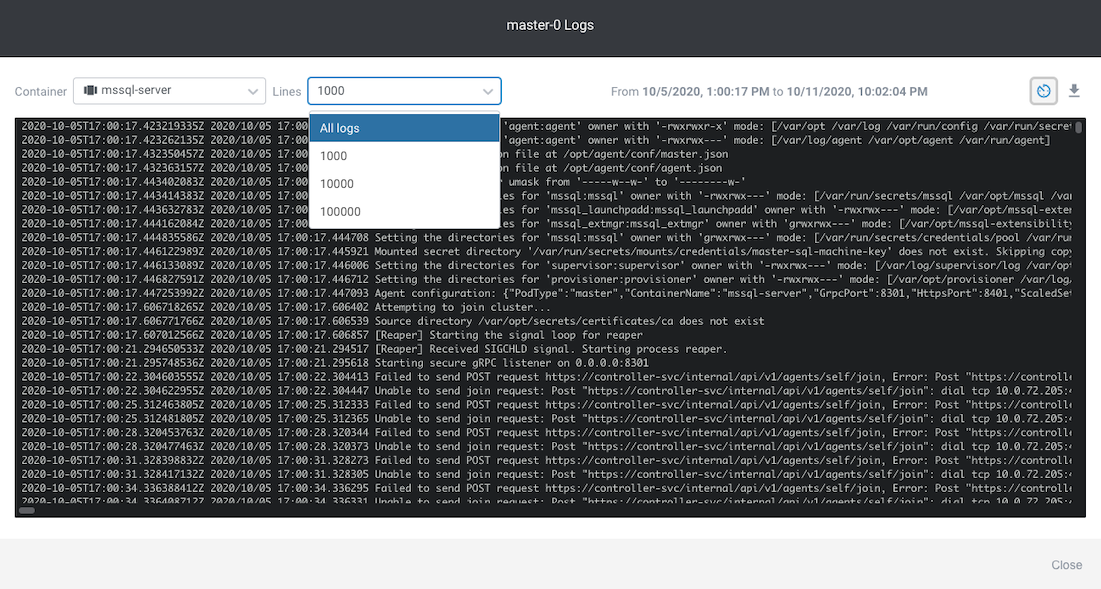
Another neat thing about Lens is you can show All logs or just a thousand (or 10k, or 100k). You can scroll through, and best part is you can save it as a .log file for further analysis!
Network
The network section shows Kubernetes services, endpoints, ingresses and network policies. Let’s take a look at the BDC network objects.
The first thing you will notice under Network is Services.
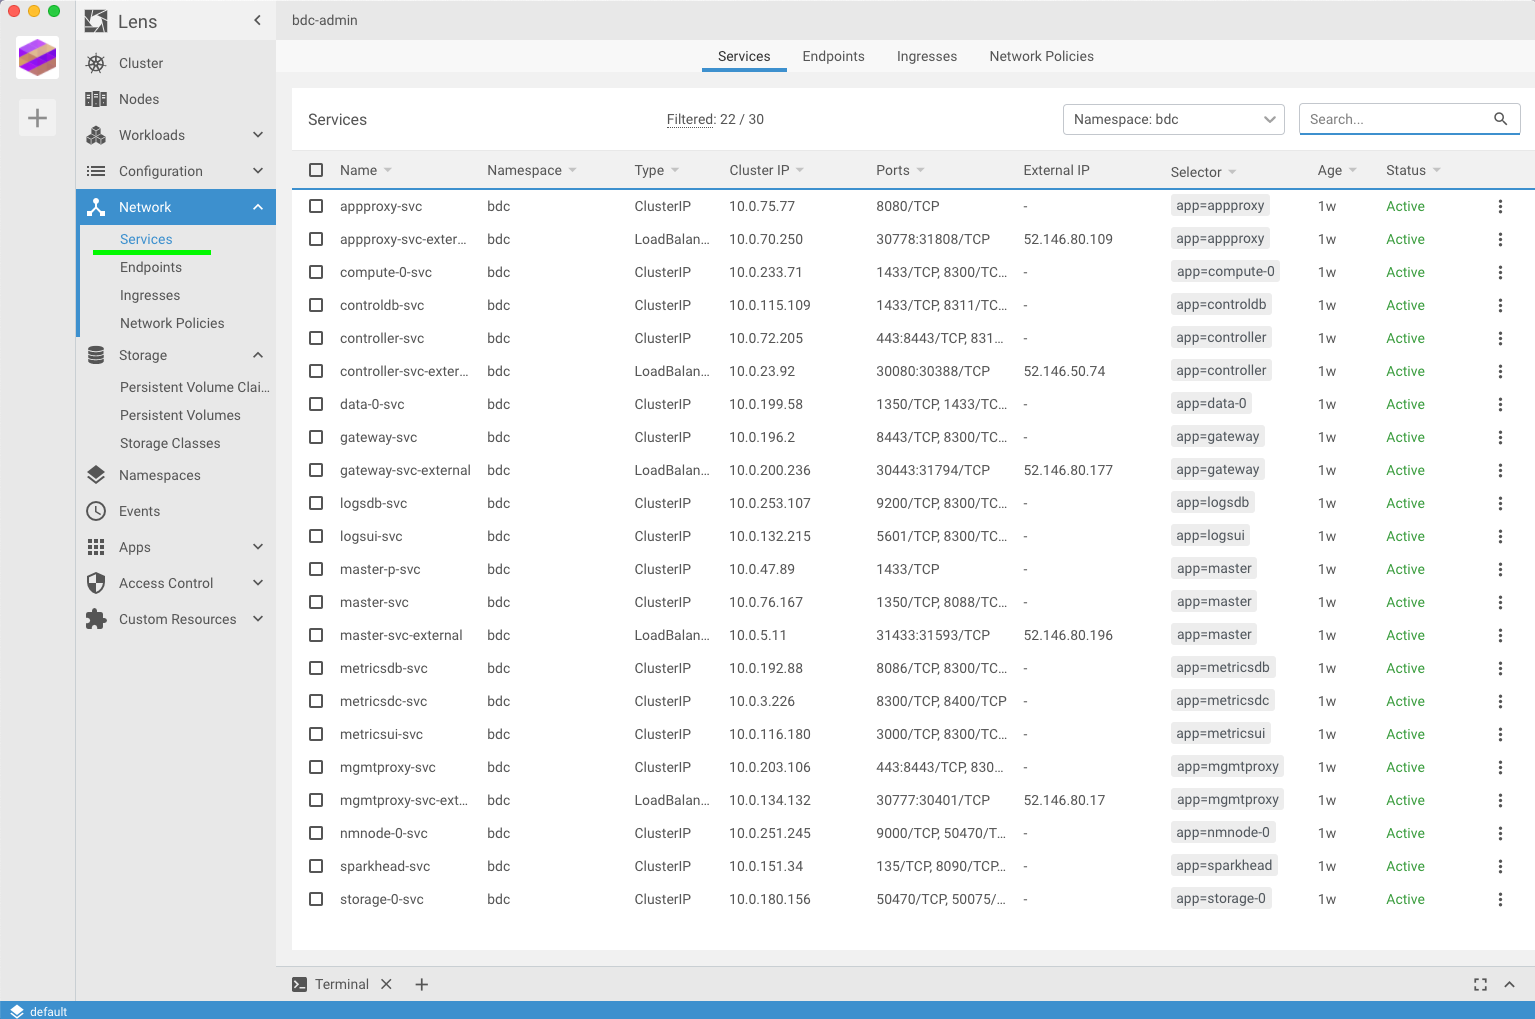
You will notice that all 22 pods have associated Services with them. What’s the deal? Well, in Kubernetes in order to allow external traffic to a pod you will have to “expose” it. This act of “exposing” it is creating a service. It’s interesting to see all the Big Data Cluster services in one visual pane. When you create a service for a pod, you give it a couple parameters like the Port number, the type of service (ClusterIP, LoadBalancer, or NodePort), etc. All that information can be see in the above screenshot. Going down the left side pane, you can view all the Endpoints, Ingresses and Network Policies (which the BDC has none)
Storage
To be able to view all the BDC storage components in one window is pretty neat! As you can see from the screenshot below, you can view all the Persistent Volume Claims, Persistent Volumes and Storage Classes.
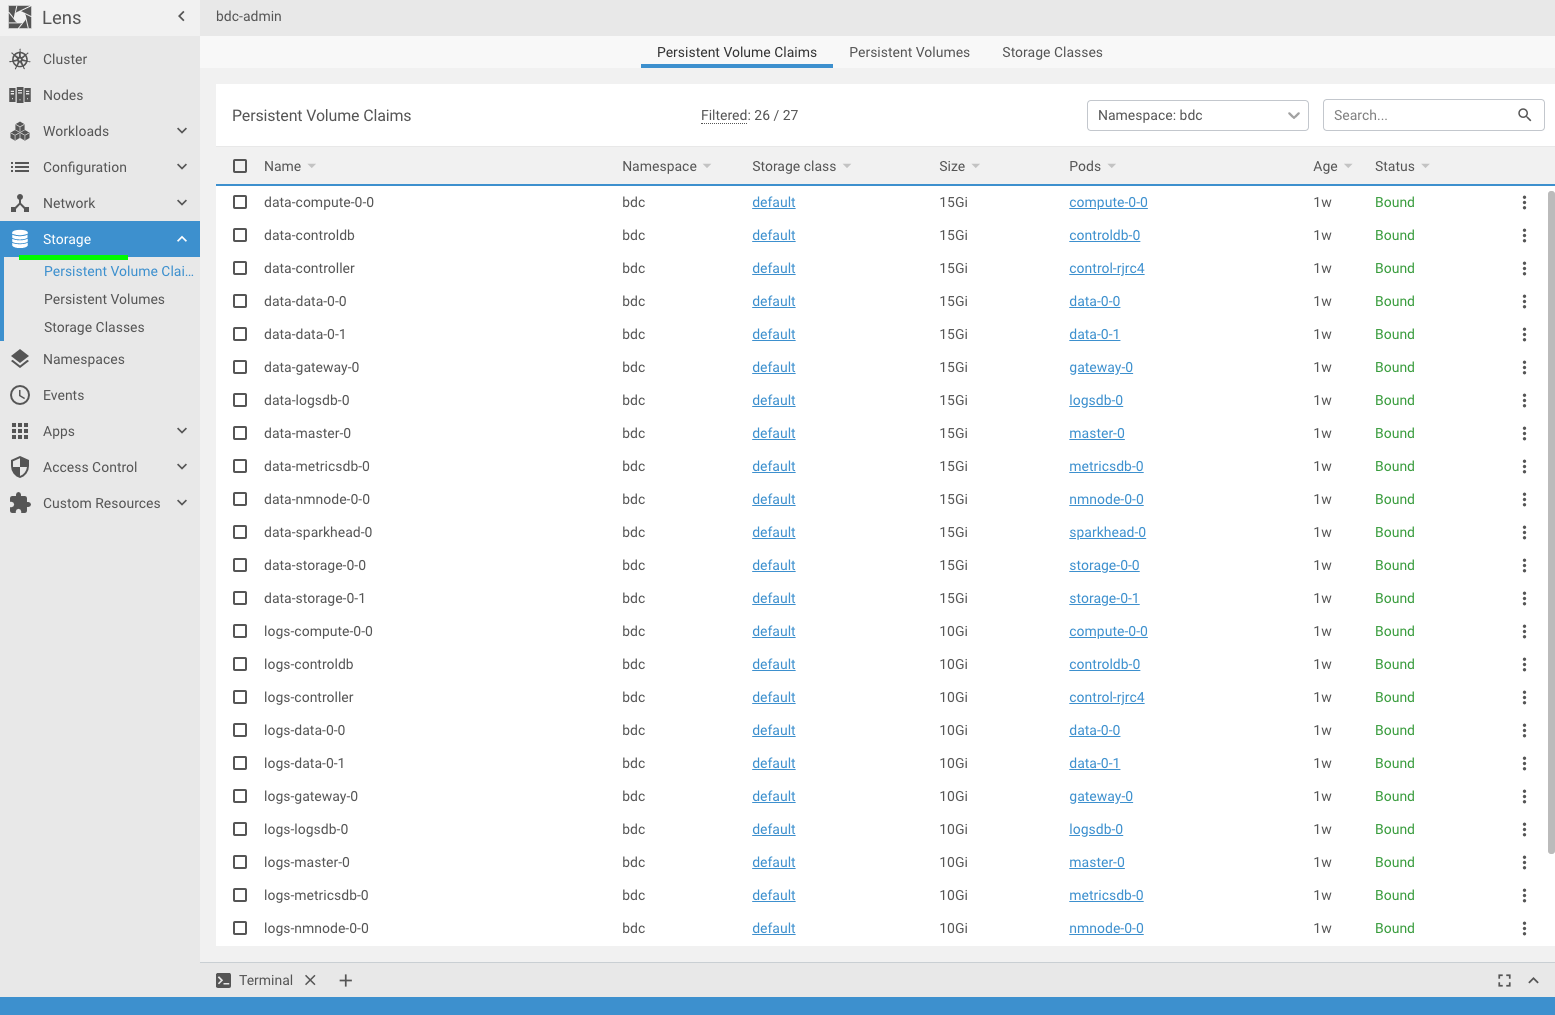
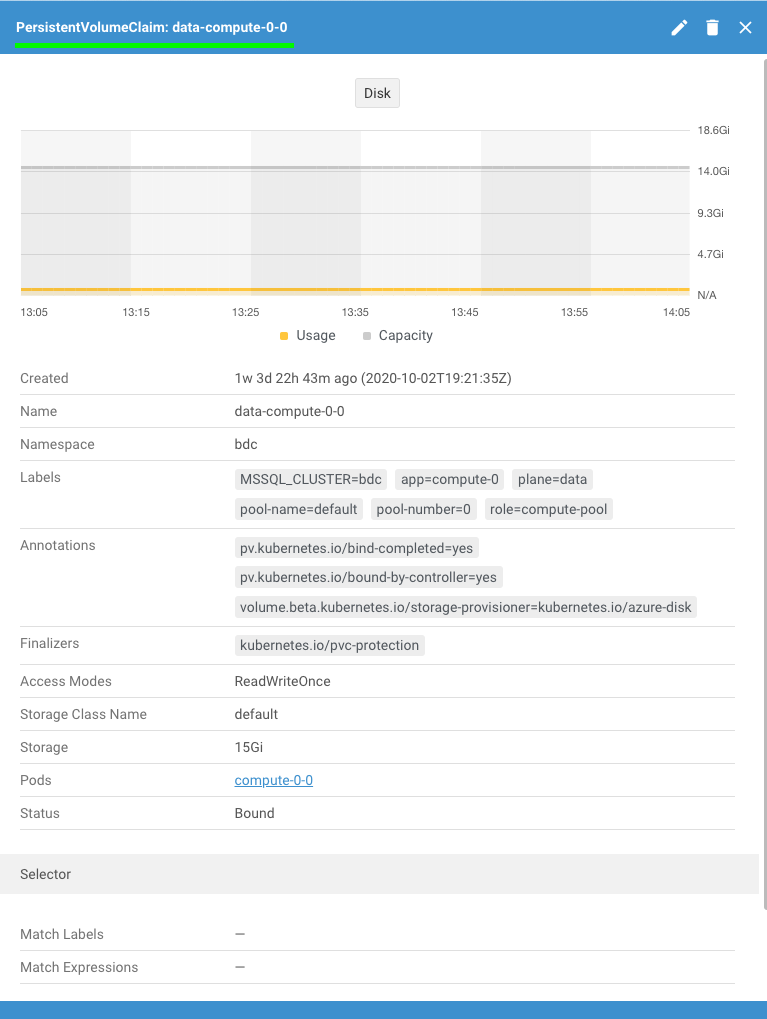
By clicking on one of the PVCs, a window pane slides in from the right that displays disk utilization, annotations (labels), Access Modes, the Storage Class Name, Storage, Pods it’s used for, and the Status.
The final piece I want to discuss is Access Control. Under it you will see:
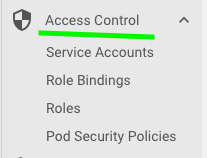
Service Accounts, Role Bindings, Roles and Pod Security Policies. If. you look at Roles you will see one (at least in my case) that is called, “namespaced-admin”. If you click that, you will see the window pane below:
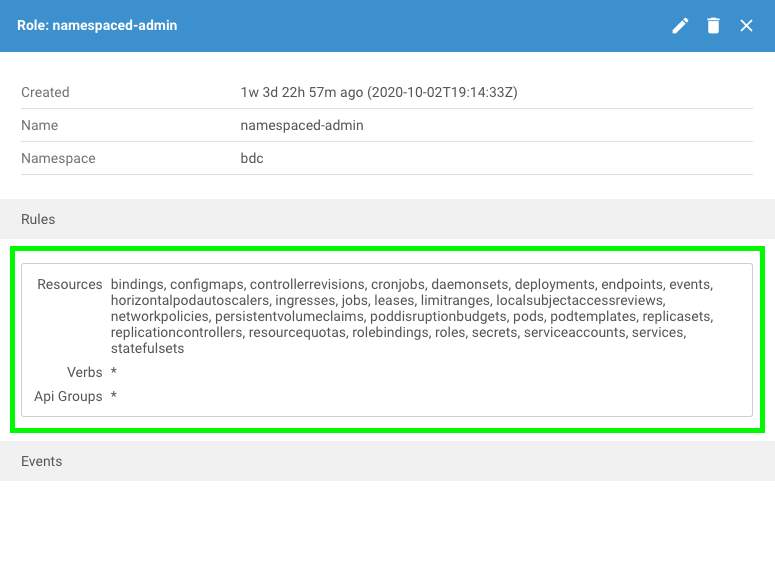
This means that there is a role named “namespaced-admin” that allows (Verbs) all actions on the resources listed above. Now, there is a Role Binding, (called rb-bdc-controller) that takes the service account “sa-mssql-controller” and “binds” it to the Role above.
Final Thoughts
I find Lens to be useful tool to get a visual understanding of all the intricacies inside a Kubernetes cluster. If you’re new to Big Data Clusters (or Kubernetes), using an IDE like Lens can be extremely useful. Feel free to download it here.
My requirement is to create big data cluster on premises . No cloud . I have windows 10 Professional .What software , hardware required and how to create step by step .Thanks
You cannot deploy BDCs on Windows machines. It has to be Linux. Please refer to my blog post here: https://mohammaddarab.com/how-to-deploy-a-big-data-cluster-to-a-multi-node-kubeadm-cluster/