Recently I was asked,
If you approached a SQL Server with abnormal usage (slow applications, etc,) and have a limited amount of time, how or what tools would you use to diagnose the issue?
I replied by saying I would execute a great script like sp_whoisactive, by Adam Machanic, or sp_BlitzFirst by Brent Ozar’s team.
He quickly replied,
Let’s assume the client in charge of the SQL Server doesn’t allow ANY external scripts to be deployed/executed on their servers.
Hmmm…
I never really thought about a scenario where the client doesn’t allow third party scripts. I told him that I’d use “Activity Monitor.”
What is Activity Monitor?
It is an instance-level tool built inside SQL Server Management Studio that allows you to get a quick “inside look” into key statistics like Processor Time, Waiting Tasks, Database I/O, Batch Requests/sec, Recent Expensive Queries, etc.
How To Use SQL Server Activity Monitor
There are 2 ways to bring up Activity Monitor in SSMS:
First way
Open SSMS, then press CTRL + ALT + A (this is the keyboard shortcut)
Second Way
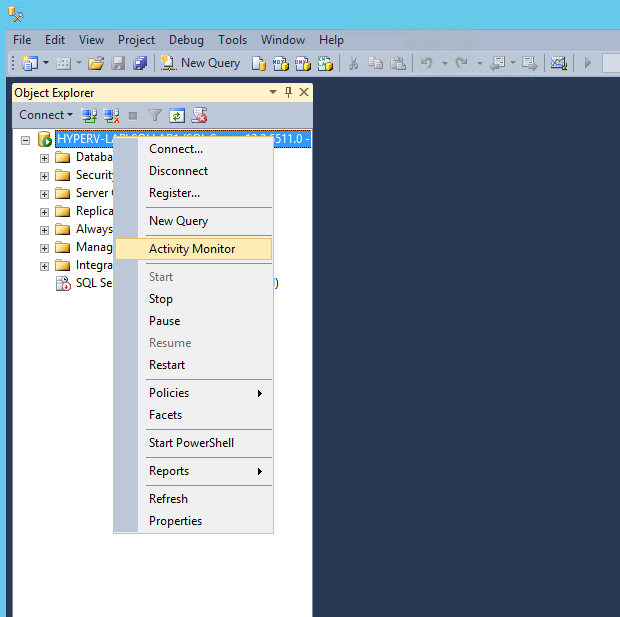
Right-click the instance and click on Activity Monitor (see screenshot)
After you click “Activity Monitor” you will get the below screen (see screenshot. Click to enlarge). After a few seconds you will see live stats under the “Overview” window.
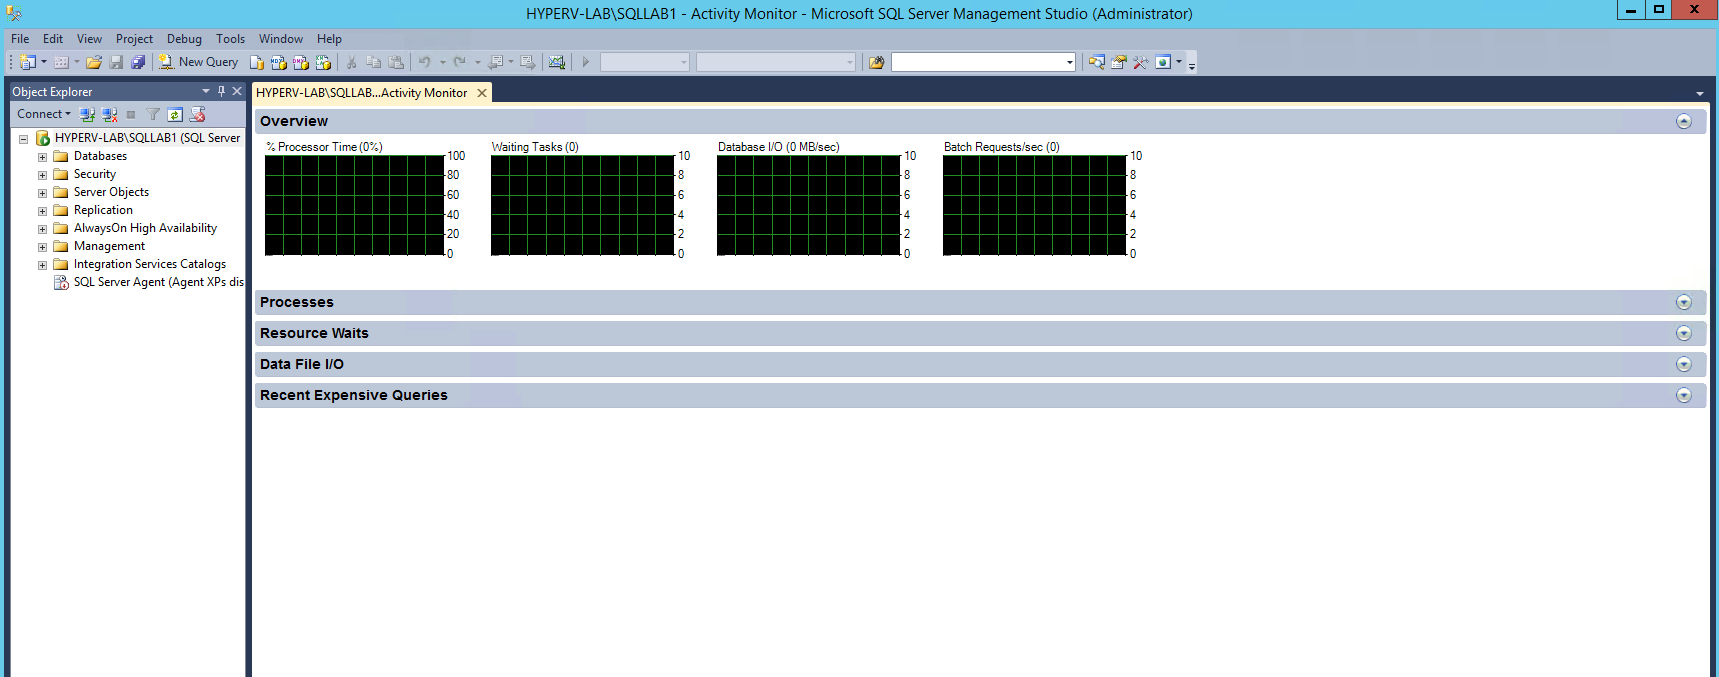
You will notice Activity Monitor has five “categories”, Overview, Processes, Resource Waits, Data File I/O and Recent Expensive Queries. Each category has a wealth of information that can help you easily determine why a certain SQL Server is under performing. Remember, you don’t always have the ability to use a thumb drive or access the internet to download a script. SQL Server’s Activity Monitor is a great first step into diagnosing a slow server.