This is part 4 of the “BDC series.” You can read part 1 here, part 2 here, and part 3 here. This blog post will go into the available monitoring tools available to monitor the health of your Big Data Cluster. If you’d like to stay updated, without doing the heavy work, feel free to register for my newsletter. I will email out blog posts of my journey down the wonderful road of BDCs.
[Updated for CTP 3.2] – There are kubectl commands and azdata commands to check the health of your cluster but I will focus on the Kubernetes Dashboard for this series. I will blog about some of the useful kubectl and mssqlctl commands in later posts.
Kubernetes Dashboard
The next method is logging into the Kubernetes dashboard. To get to this dashboard you have to execute the following command in Powershell (or Azure CLI):
az aks browse –resource-group YourResourceGroup –name nameOfCluster
az aks browse --resource-group YourResourceGroup --name nameOfCluster
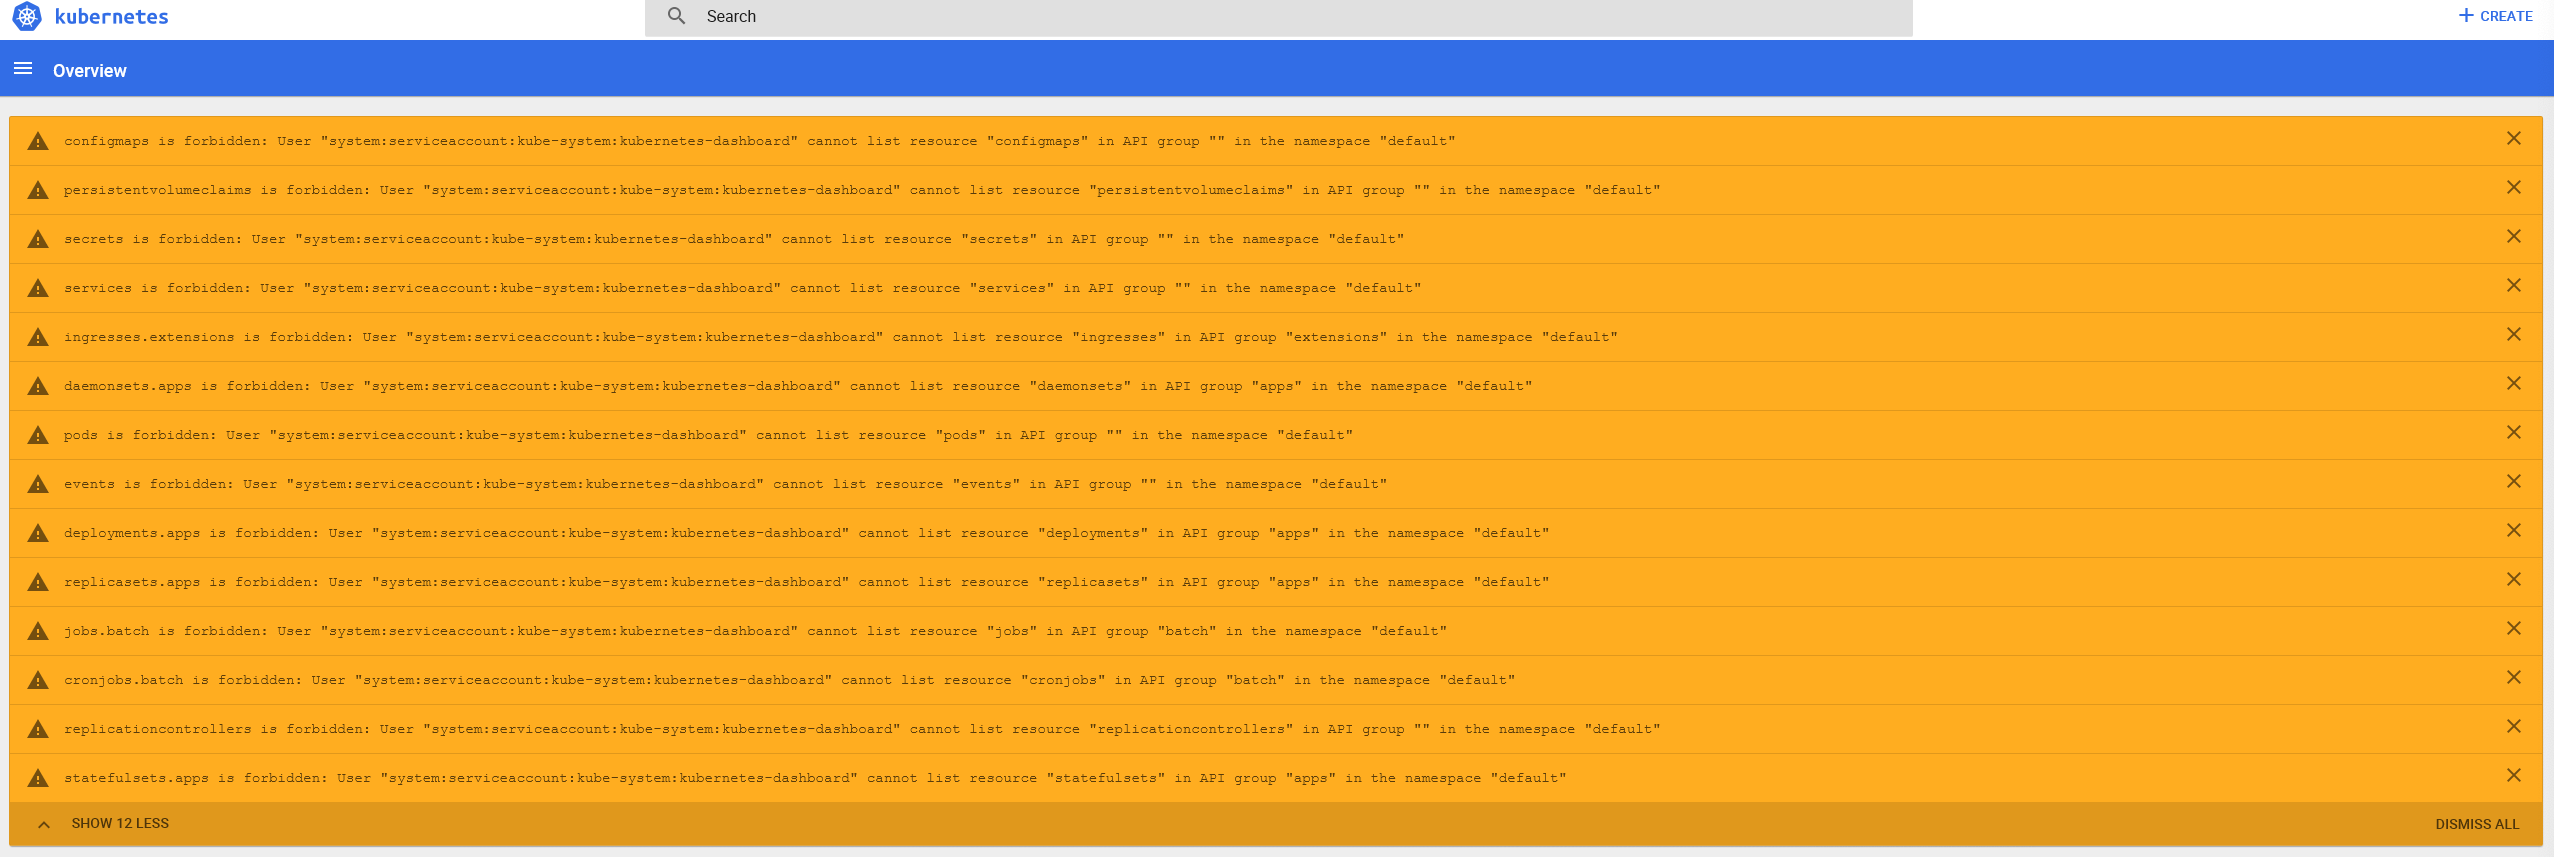
Note #1: When I first logged into the Kubernetes dashboard I saw a bunch of errors (see below)
Since we are deploying our cluster on AKS, you might get permission warnings due to RBAC being enabled by default in AKS. The service account used by the Kubernetes dashboard does not have enough permissions to access all resources. To remedy this, execute the following command that will grant the appropriate permissions:
kubectl create clusterrolebinding kubernetes-dashboard -n kube-system –clusterrole=cluster-admin –serviceaccount=kube-system:kubernetes-dashboard
kubectl create clusterrolebinding kubernetes-dashboard -n kube-system --clusterrole=cluster-admin --serviceaccount=kube-system:kubernetes-dashboard
After I executed the above command, I restarted my browser and was able to log in with no problems.
Note #2: If you get the following error:
Unable to listen on port 8001: All listeners failed to create with the following errors: Unable to create listener: Error listen tcp4 127.0.0.1:8001: >bind: Only one usage of each socket address (protocol/network address/port) is normally permitted. Unable to create listener: Error listen tcp6: address [[::1]]:8001: missing port in >address error: Unable to listen on any of the requested ports: [{8001 9090}]
Check if you do not have 2 or more browsers running the Kubernetes Dashboard. You can only have one running at any given time.
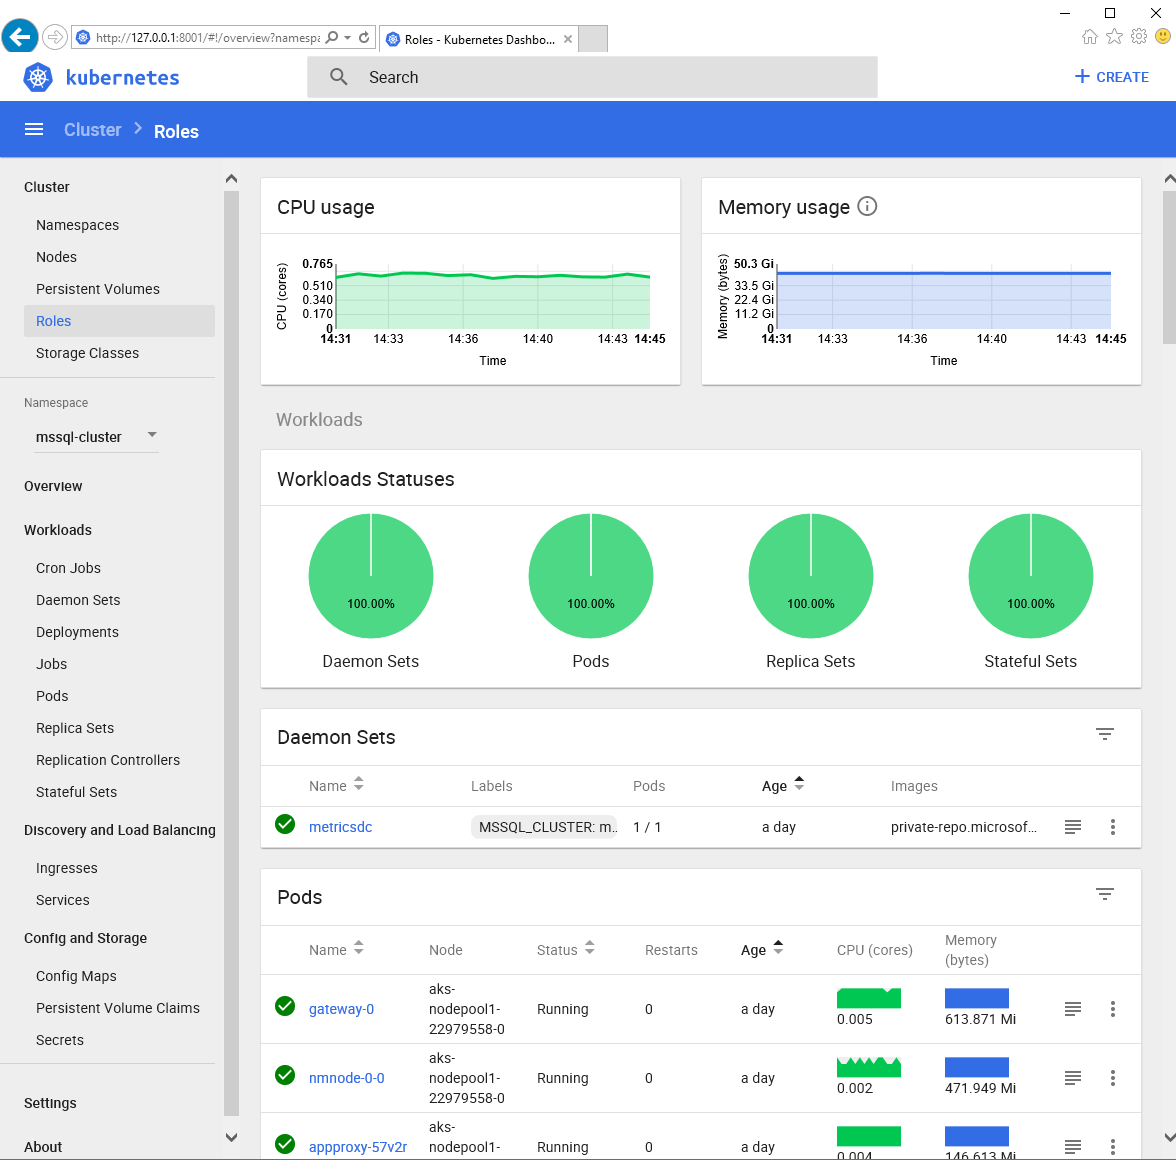
As you can see, the Kubernetes dashboard gives you a wealth of information. Too much to go into in this blog post but you should definitely “click around” and get familiar with all the panes and options. Enjoy!


One Reply to “How to Setup SQL Server Big Data Cluster in Azure (AKS) – Part 4”